
Biased Tide Gauges Mean We’ve Been Systematically Underestimating Sea Level Rise
Most historical tide gauges were installed in the northern hemisphere, a legacy that has been skewing scientists’ modern interpretations of sea level rise.
Article body copy
In harbors and ports around the world, tide gauges bob up and down with the sea, recording its height over time. In some places, these instruments—through various iterations—have been recording continuously since 1700. Originally installed to help fishing and merchant vessels plan when to enter and leave harbors, the data produced by these old-school gauges has been co-opted by scientists, and now forms the basis of climatologists’ understanding of long-term sea level rise. But as a new study shows, because the majority of these tide gauges were located in North Atlantic port cities, scientists have been systematically underestimating the rate of global sea level rise.
“The gauges are concentrated in the northern hemisphere, in Europe and North America, where traditionally we’ve had a lot of shipping and commerce,” says Phil Thompson, an oceanographer at the University of Hawai‘i at Manoa. “That’s contributing to why we don’t get really good spatial coverage over the globe.”
Sea level rise is not occurring evenly across the planet. Tides, currents, and weather systems constantly alter sea levels, while tectonic forces move the land. Changes in Earth’s gravity and rotation also affect sea level, and melting ice caps cause a host of complex effects.
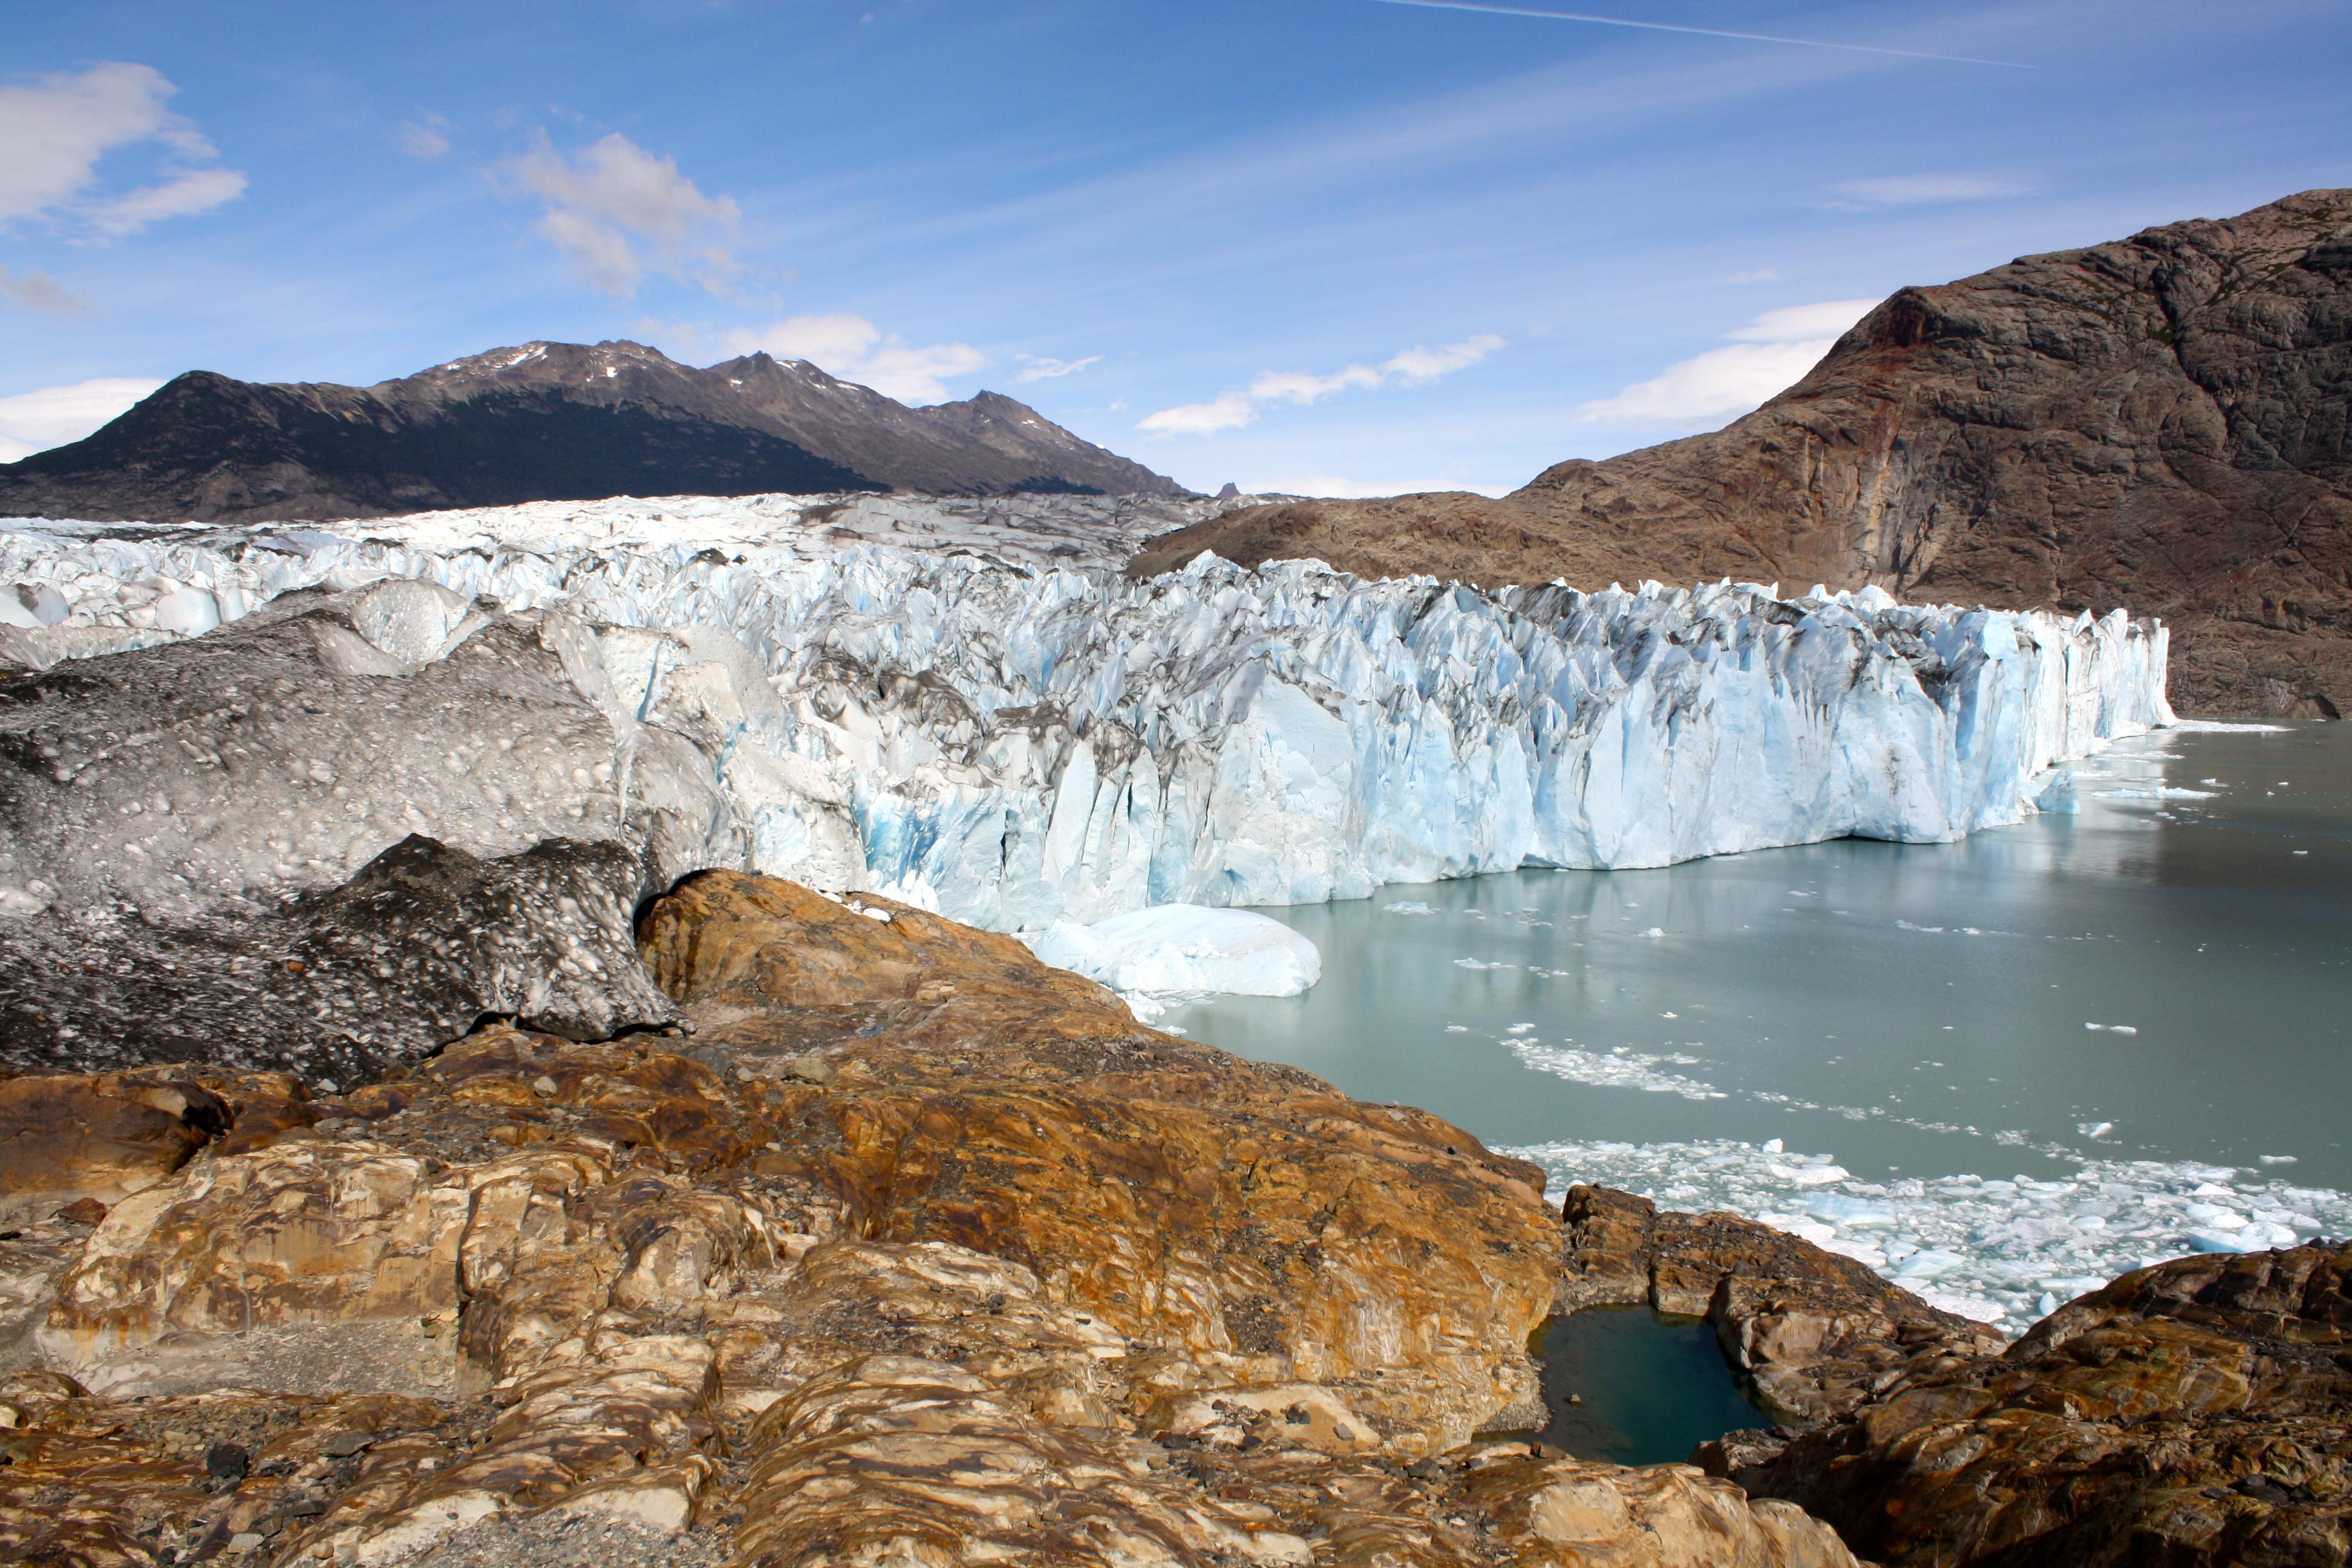
The northern hemispheric concentration of historical tide gauges caused researchers to misrepresent the effects of melting glaciers on global sea level rise. Photo by EyeEm/Alamy Stock Photo
The result of this northern hemispheric concentration in tide gauges, then, is that long-term records have provided data that has led scientists to underestimate the rate of 20th-century sea level rise by as much as 0.2 millimeters per year, says Thompson. This is a fairly large amount, as the average rate of sea level rise over the past century is thought to be around 1.7 millimeters per year.
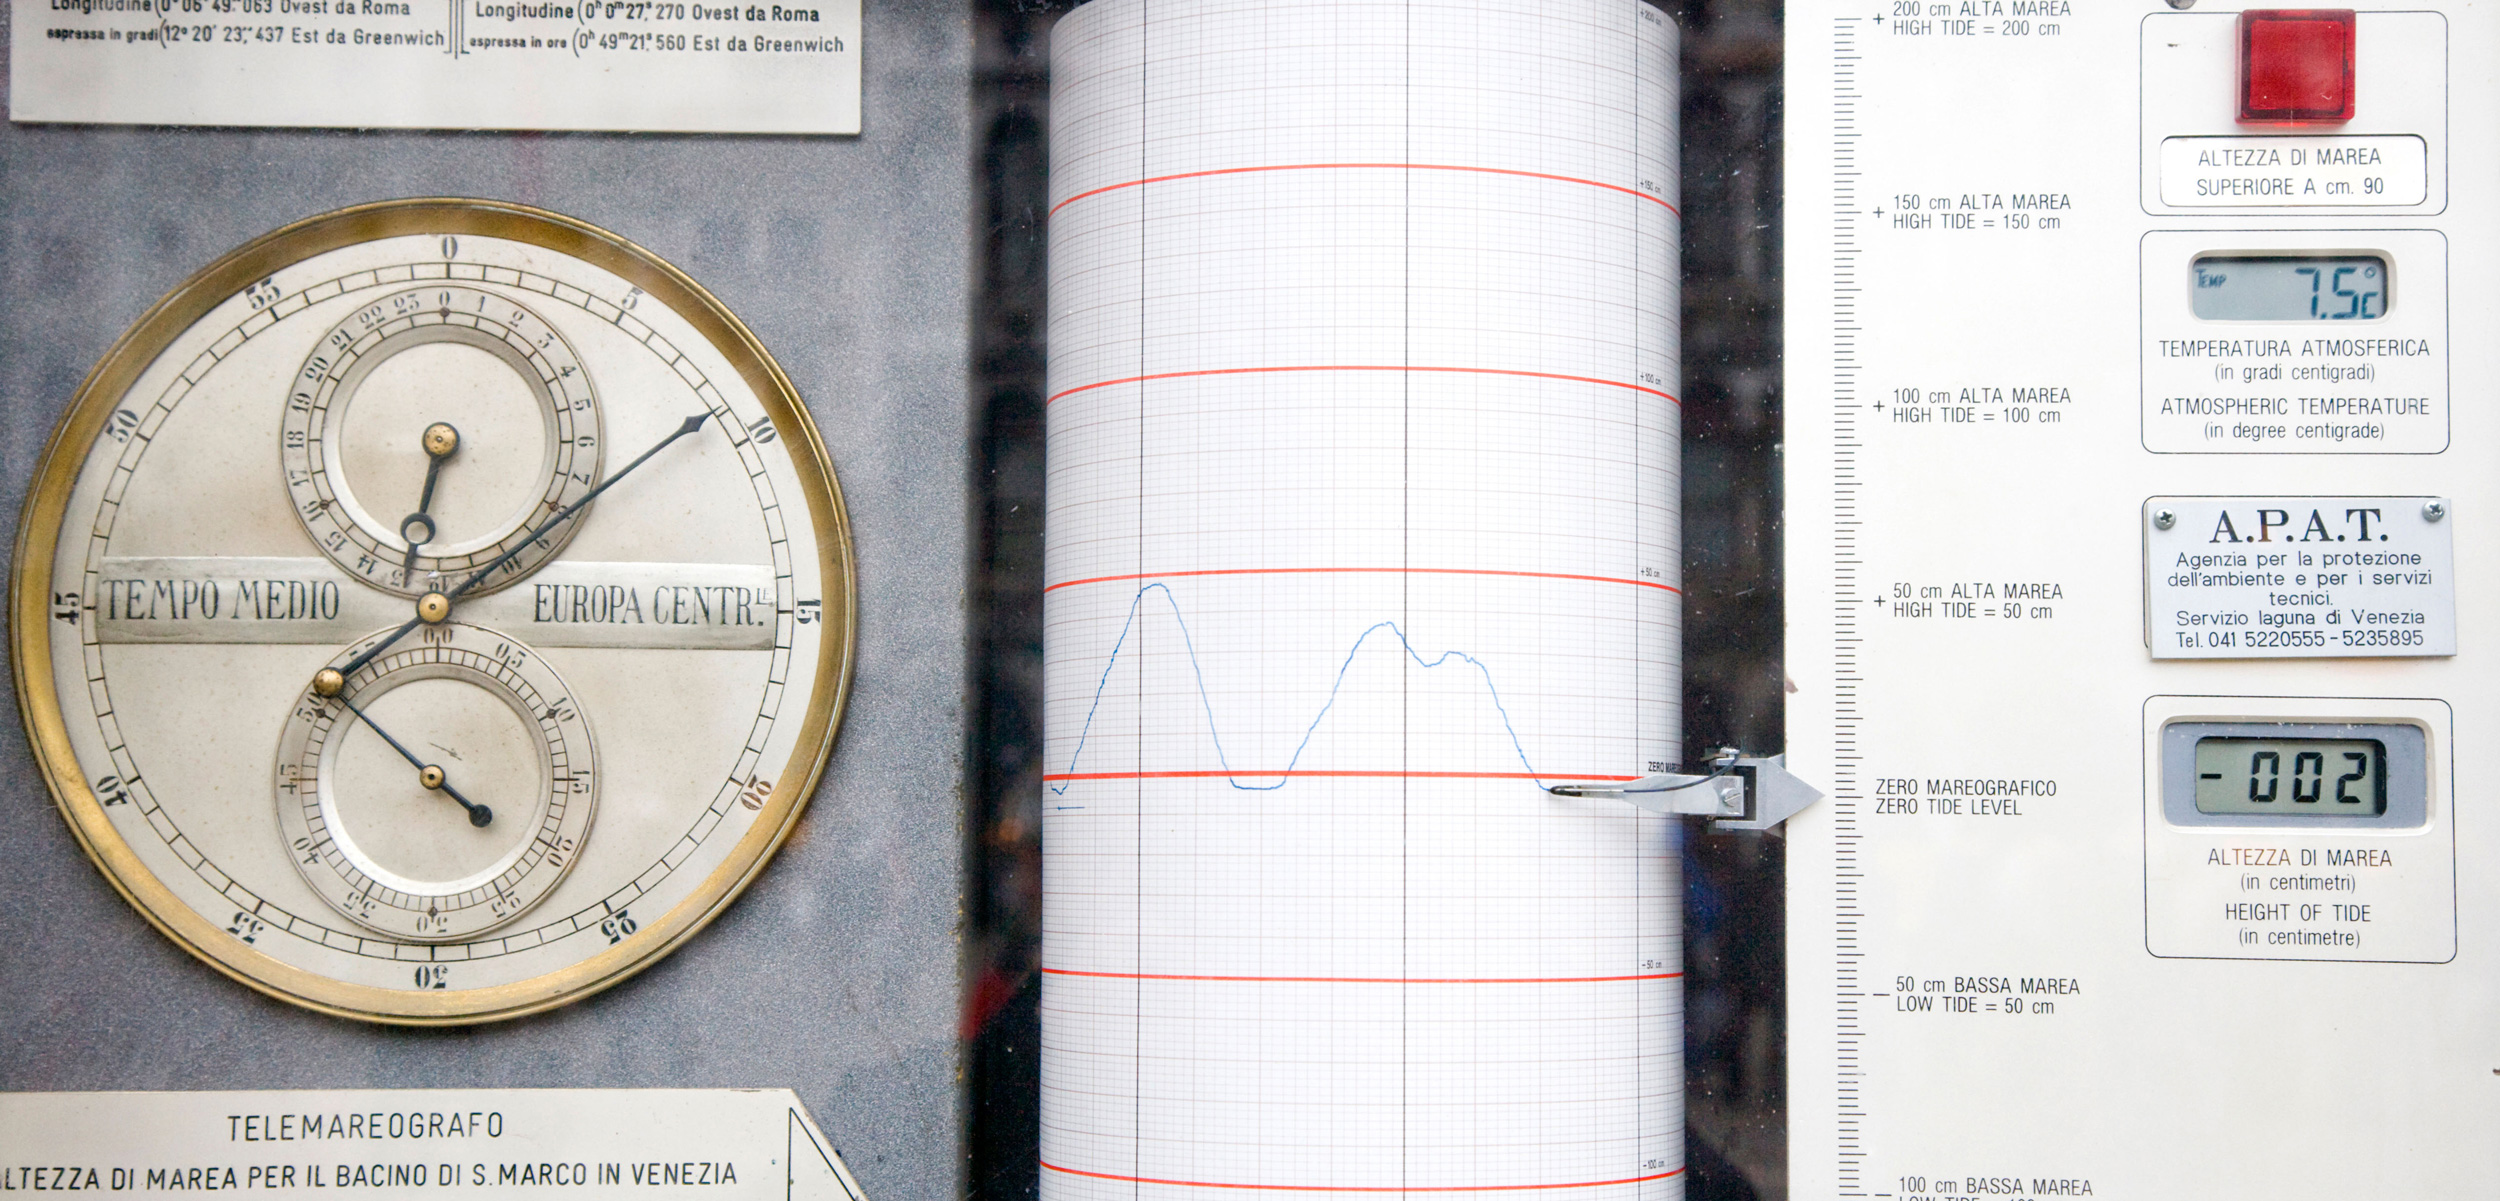
People have measured the rise and fall of the tides for millennia. In the 3rd-century BCE, Greek explorer Pytheas of Massalia reportedly took note of the tides of Great Britain, and he was the first to notice a correlation between tides and the Moon. But the oldest tide gauge records still in existence date from the 18th century, and are centered in the port cities of Europe and North America. The oldest tide gauges were simple structures, consisting of a long metal tube with an opening under the water which minimized the effects of waves or passing ships. At regular intervals, an observer would record the water level relative to a fixed point on the land.
In the United States, the government started surveying coastlines in 1807, at the behest of Thomas Jefferson, who saw the measurements as valuable for exploration, commerce, and safety. According to the US Congress, accurate charts of the coastline and tides would help naval forces and merchants alike.
In 1851, the US Coast and National Geodetic Survey installed the first self-recording gauge in San Francisco. It contained a pen resting on a scroll that rotated at a constant rate, and when the pen moved up and down with the tides, it traced a graph of water levels.
Over time more tide gauges were installed, and these long-running records became vital to science in a way Jefferson would never have anticipated, says John Fasullo, a sea level rise expert at the National Center for Atmospheric Research in Boulder, Colorado.
“You have this problem a lot in climate science,” Fasullo says. “You have some record that exists that was installed with a different intent, and then it’s the only data you have for understanding climate, so you use it any way you can.
“The kind of work [Thompson] is doing is very important for understanding the biases in this data set, which was never designed originally to monitor global mean sea level.”
Specifically, the main source of bias that Thompson found stems from how ice sheets affect regional sea level.
Ice is heavy, so enormous sheets create a subtle gravitational pull, and affect the Earth’s rotation. The result is that ice sheets attract water toward themselves. As these ice sheets melt into the sea, this gravitational pull relaxes. Water slowly moves away from them, and is redistributed toward areas with stronger gravitational pulls, explains Fasullo. Initially, cities near the site of melting ice might see localized sea level rise, but over time they will experience less.
This redistribution of water means tide gauge records of average sea levels in northern hemisphere cities are artificially low, because the northern hemisphere’s ice sheets are thought to be the largest sources of melt. Since tide gauges were predominantly installed in northern hemisphere cities, this is the source of the systemic bias.
The result adds to a growing body of research that suggests the sea level can change dramatically over shorter time periods than expected, says geoscientist Ben Horton of Rutgers University, who measures past sea levels using core samples. He says the result suggests climate models might not be calibrated correctly, which raises questions about their predictions for future sea level rise.
“This is not a feel-good moment. Showing that it is rising faster is not a good answer,” he says. “That indicates that our oceans are even more sensitive to climate change than we previously thought.”
The good news is, now that scientists are aware of this source of bias, they can take it into account in future climate models, Thompson says. The bad news is sea level rise may be happening more quickly than scientists thought.